No Country for Old Biotechs
Why does an index of biotech IPOs since 2018 beat the XBI when more than half of the companies lose 80% or more of their value?
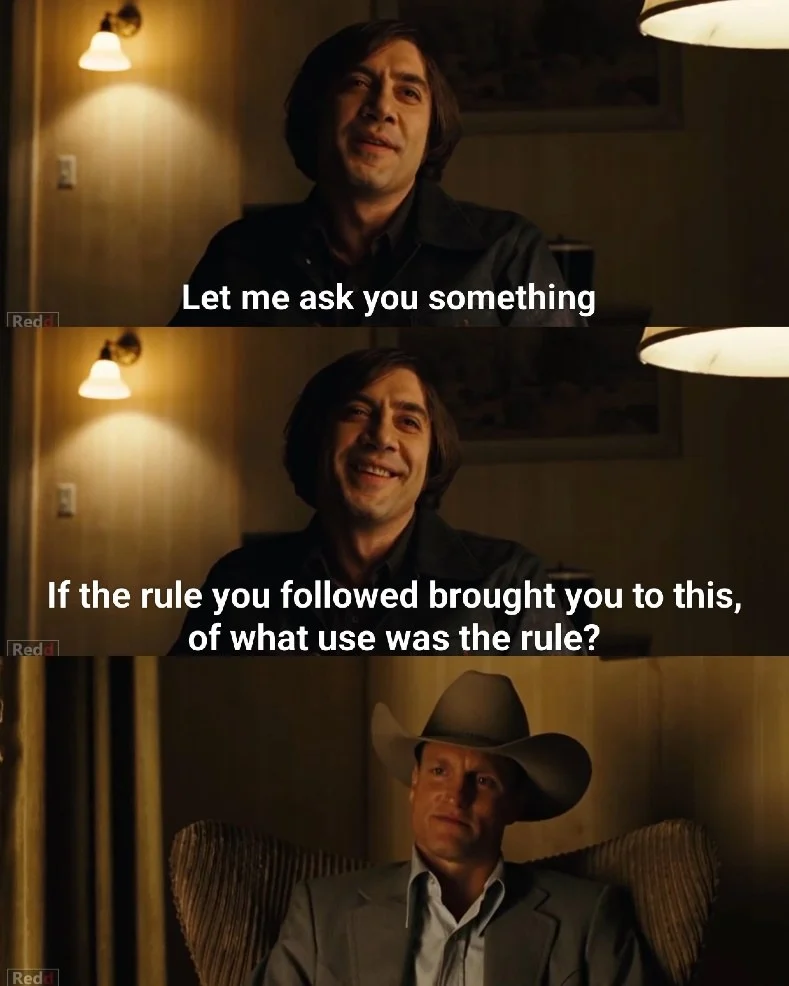
Image: No Country for Old Men (2007), directed by Joel and Ethan Coen; Miramax Films and Paramount Vantage. Frames via Reddit, r/moviecritic.
One particularly provocative comment on my last letter came from a reader who cited Michael Cembalest’s August 2025 market commentary, Sick as a Dog, writing that “all I can say from an asset allocation perspective is that the chart on page 20…is one of the ugliest and most depressing charts [I have ever seen].” The chart showed that more than 50% of biotech IPOs lose at least 80% of their value after going public.
I thanked the reader for pointing it out but noted that my argument was never about buying biotech IPOs, which, as a practitioner, I’ve long known are generally poor bets (though the same can be said of IPOs more broadly). Rather, it was about the virtues of owning a diversified, roughly equal-weighted basket of biotech companies, which captures a unique source of growth that is largely uncorrelated with the broader market and further benefits from the low correlations among individual biotech stocks.[i]
What I loved about the comment was that it raised an interesting question: why have biotech IPOs performed so poorly relative to a roughly equal-weighted benchmark such as the S&P Biotechnology Select Industry Index? Is it a matter of declining IPO quality, or does the index itself benefit from some embedded advantage, whether through its rebalancing, weighting or a seasoning effect created by the eligibility requirements for inclusion?
Quality or Rebalancing?
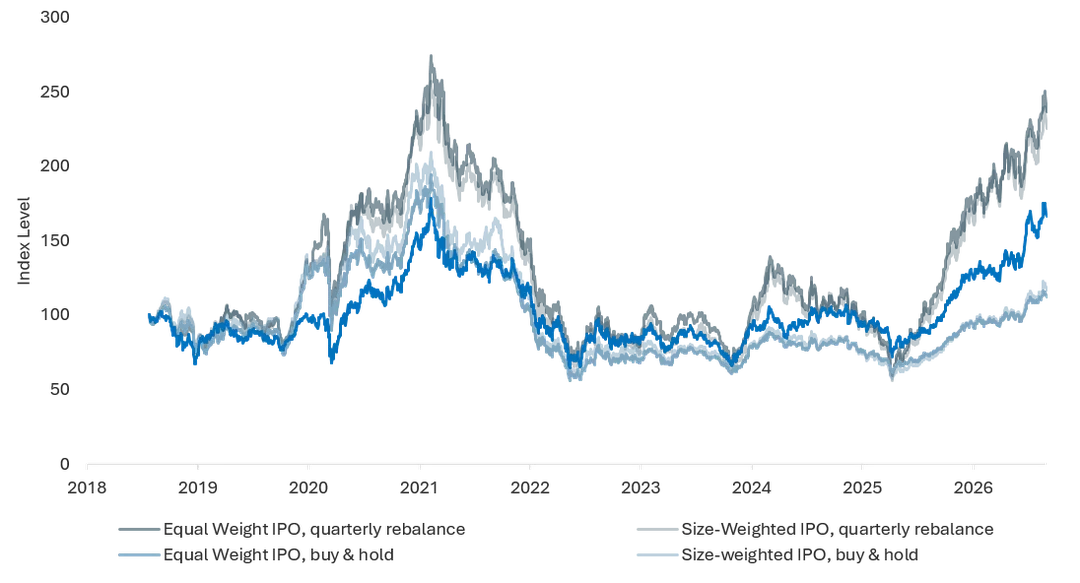
I decided I needed some data to test these hypotheses. I sourced healthcare, biotech, and life sciences IPO metrics from three law-firm publications covering 2018 through 2026,[ii] screened out device, life sciences tools, and other non-therapeutics IPOs, and pulled historical data on both listed and delisted companies. The first lens was to recreate similarly weighted IPO indices for the period and compare them with the State Street SPDR S&P Biotech ETF (XBI), which tracks the S&P Biotechnology Select Industry Index. That exercise quickly ruled out the notion that this cohort was somehow lower quality than the companies represented in XBI. Understanding why, however, required building four versions of a 2018–2026 IPO index: equal-weight and IPO-offering-size-weighted, each as buy-and-hold and rebalanced quarterly (Figure 1).
Figure 1: Four versions of a 2018–2026 biotech IPO index (index level, par = 100)
Source: Yahoo Finance, FactSet, Ascendant BioCapital Analysis; share price data as of August 31, 2026
Even allowing for differences in how they are constructed,[iii] the first thing that jumps out is how closely correlated all four indices are with XBI. The second, and far more important, observation is that rebalancing appears to account for almost all of the outperformance over XBI: offering size imparts almost no information about quality. In the most direct apples-to-apples comparisons, the quarterly rebalanced IPO indices, whether equal-weighted or weighted by offering size, consistently outperform XBI, albeit with substantially greater volatility, which is consistent with a cohort of smaller market capitalizations.
A Call Option on Intellectual Property
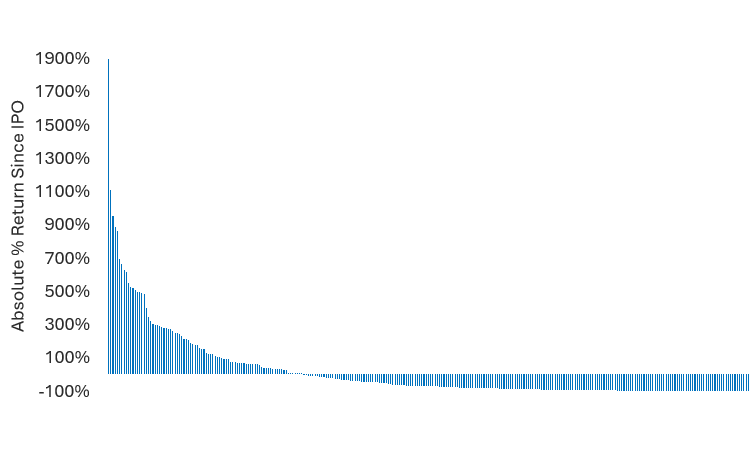
The second lens I used to understand the performance of biotech IPOs was absolute returns at the individual issuer level. Figure 2 is a waterfall plot of returns from each company’s IPO date, sorted from best to worst. Roughly one-third of IPOs make money, and nearly half lose more than 80% of their per-share value.
Figure 2: Absolute return since IPO, by company, sorted from best to worst
Source: Yahoo Finance, FactSet, Ascendant BioCapital Analysis; share price data as of August 31, 2026
A public listing is a living valuation, continuously updated through a dual secondary auction of multiple buyers and sellers as new information emerges. In most of the stock market, that information becomes known in near-real-time through earnings, guidance, channel checks, credit card data and other proxies used by analysts. The result is remarkably efficient pricing given how much information is reflected in a company’s share price.
In biotech, information flows sporadically. Most of it comes through clinical data releases, events that are intrinsically unknowable before they occur, which is the beauty of experimentation and empiricism. Like Schrödinger’s cat, which is simultaneously alive and dead until the box is opened and the cat is observed, a biotech’s trial is both a success and a failure until the data are observed and analyzed through statistics.[iv] That makes the risk discrete rather than continuous, and in my experience discrete risk is where prices are least efficient and most diversifying.
This inherently binary, quantum-like dynamic explains why modeling biotech equity at the portfolio level requires a shift in analytical methods. What distinguishes biotech from traditional equities is that market value is driven less by incremental revisions to expected cash flows and more by sudden changes in the probability of reaching those cash flows in the first place.
Viewed from the asset side of the balance sheet, a biotech is essentially a steadily shrinking pool of cash funding experiments on a portfolio of intellectual property that may or may not culminate in an approved branded drug with monopolistic-like exclusivity under its patent term and applicable statutory protections.[v] Liabilities are typically modest, leaving equity as the principal source of capital. With the balance sheet dominated by cash and an idiosyncratic asset that is continuously repriced as new data emerge, biotech equity behaves less like a traditional operating business and more like a long-dated call option on intellectual property.
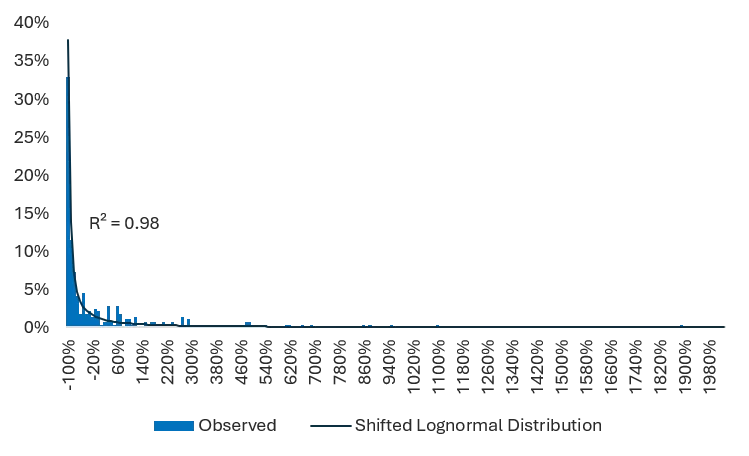
Empirically, this manifests as a shifted lognormal distribution of biotech IPO returns that fits the data with near-perfect precision (R² = 0.98; Figure 3).[vi] This distribution reveals a brutal yet lucrative reality: losses are capped at -100% when options on intellectual property expire worthless, while nearly one-third of companies populate a fat right tail of positive returns, with the most successful approaching 20x their IPO value.
Figure 3: Distribution of biotech IPO returns vs. a fitted shifted lognormal distribution
Source: Yahoo Finance, FactSet, Ascendant BioCapital Analysis; share price data as of August 31, 2026
To see how this asymmetry translates into portfolio-level results, compare the typical individual outcome with the aggregate cohort return (Table 1). The model implies that a typical individual investment in this cohort returns -81%, about 10 percentage points worse than the observed median. In aggregate, however, the right tail reverses the expected return: because the observed log-standard deviation is an extraordinary 2.814, squaring it and dividing by two adds an immense amount of “volatility wealth” back into the exponential function.[vii]
Table 1: Predicted vs. observed returns for the 2018–2026 biotech IPO cohort
Median / | Probability Investment Breaks Even | Arithmetic Mean | |
Predicted | -81% | 28% | +892% |
Observed | -71% | 31% | +21% |
Source: Ascendant BioCapital Analysis
While the predicted median and chance of breaking even are reasonably close to the observed values, correctly capturing the reality that most biotech IPOs lose money, the predicted mean is squarely in fairytale land. The fitted lognormal distribution implies that roughly 5% of companies should generate returns greater than 20x and that the very best 1% of outcomes should exceed 100x. Among 289 companies, only one approaches a 20x return and none come close to 100x.[viii]
One reality of the biotech sector goes a long way toward reconciling the model with our data: upside for most biotech companies is capped. Few successful companies go on to commercialize their own drug; most are acquired or license their product to a large pharma before ever doing so. Indeed, McKinsey’s analysis of Evaluate Pharma data found that more than 70% of large pharma’s revenues from new drugs is insourced from small companies.[ix] The result is that the right tail’s returns tend to be censored, and even where they are not, the kind of transcendent success we’re talking about (20-100x or greater returns) takes time to materialize (think of the next Amgen, Gilead, Vertex, Biogen, Regeneron, Incyte, United Therapeutics, or Argenx).[x]
The interpretation of the model is therefore structurally correct, rather than literally correct. It describes the floor (absolute loss) well, and the median outcome and the win rate (31% observed vs. 28% predicted) reasonably well. For a fund manager or an index investor, this means individual asset selection is a statistical minefield, but aggregate cohort exposure still converts high levels of risk into sector returns, given enough diversification and proper rebalancing.
Theta and Gamma
Given our conceptual framework of biotech equity as a real call option on the intangible assets on its balance sheet, returns should not only follow a right-skewed lognormal distribution; the asset’s value should also be a function of time to expiration. An option’s price has two components: intrinsic value, which is what it would be worth if exercised today; and extrinsic value, which is a function of time and volatility that compensates for the chance that new information emerges before expiration and moves the option further into the money. Extrinsic value decays at a rate known as theta, and the option’s non-linear relationship with the underlying price gives it curvature, or gamma.
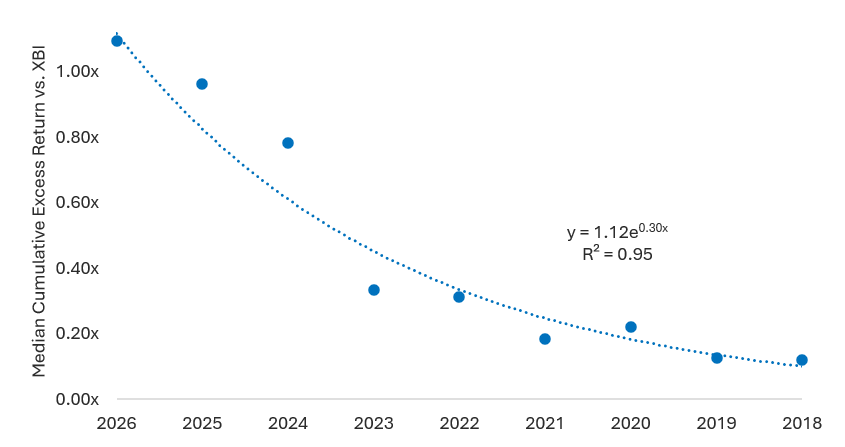
The IPO data bear this out. When median IPO returns are measured relative to the XBI and analyzed by vintage year, median excess returns decline exponentially with time since IPO (y = 1.12e⁻⁰·³⁰ˣ, where x represents years since IPO; R² = 0.95; Figure 4). The most recent vintages trade roughly in line with the benchmark, while cohorts that have been public for five to eight years retain only 10 to 20 cents on the dollar relative to it. That is theta: the extrinsic value of unresolved experiments erodes as cash is spent and time passes, whether or not any individual trial has read out.
Figure 4: Median cumulative excess return vs. XBI, by IPO vintage
Source: Yahoo Finance, FactSet, Ascendant BioCapital Analysis; share price data as of August 31, 2026
It is also, I suspect, a large part of the answer to the question I started with. A quarterly rebalance keeps recycling capital into fresh extrinsic value, while a buy-and-hold portfolio of IPOs lets it decay.
The median hides the option’s embedded convexity: gamma. This represents the potential for a discrete re-rating prior to the option’s expiration. The 2019 and 2021 vintages each feature companies that have outperformed the XBI by more than 17-fold (data not shown). A biotech company may track its time-decay curve for years until a clinical, regulatory, strategic, or financial milestone acts as a catalytic trigger, resolving uncertainty and discontinuously re-rating the share price.
Unlike Schrödinger’s cat, which has an equal probability of being alive or dead, biotech events do not have a 50% probability of success or failure. A good analyst can update prior probabilities by applying first-principles understanding of the pathophysiology, the mechanism of action of the drug and its relevance to that pathophysiology, and by drawing on the pharmacology, toxicity and clinical evidence in a given program’s prior datasets (often not fully public, but inferable from the summary information that is) or in datasets from precedent molecules. This means that an equal-weighted, quarterly rebalanced index approach to investing in biotech, while fine and profitable, is still an inefficient allocation of resources: if the market acts as a sorting machine for winners and losers, an edge can be applied to that sorting function. Steady decay punctuated by rare, violent re-ratings is exactly the environment in which analysts with a real edge in judging which of Schrödinger's experimental boxes are worth opening can generate outsized returns.
Put together, small-cap biotech investing offers a venture-capital-like payoff structure in a semi-liquid public market: time decay punctuated by occasional outsized winners, with portfolio returns driven by a right tail of successes and the ability to actively control exposure throughout the investment lifecycle.
How Much Should You Own?
From an asset allocation perspective, what makes this useful is that the payoffs are driven by biology and statistics rather than by the business cycle. Whether a drug works has nothing to do with the Federal Reserve’s interest rate policy or global supply chains, and while biotech stocks still move with the market, the XBI’s correlation with the State Street SPDR S&P 500 ETF Trust (SPY) since 2006 is 0.64, well short of one. That leaves the question of how much of it to own.
Biotech is a small pond. Once tools, device and other non-therapeutics companies are excluded, the biotechs doing the discovery and development work behind roughly 70% of tomorrow’s drugs have an aggregate market capitalization of less than half a percent of the equity market.[xi] Yet they are responsible for seven of every ten new drugs that will have to replace the $340 billion of revenue subject to loss of exclusivity by the end of 2030.
How much should an investor own? The most principled answer I know comes from John Kelly’s 1956 work at Bell Labs, later brought to investing by Ed Thorp: choose the allocation that maximizes the expected logarithm of wealth, which is the allocation that maximizes long-run compound growth. Kelly rewards assets that earn a lot, earn it with low volatility and don’t move in lockstep with everything else in the portfolio; it is, in effect, the volatility term discussed above turned into a decision rule. Using daily total returns for the SPY since 1993 and the XBI since 2006, full Kelly would hold 287% of capital in the S&P 500 and 60% in biotech.[xii] No sensible investor should run three and a half times leverage on the basis of a formula that assumes, among other things, zero financing costs. Removing the leverage yields portfolio weights of 83% SPY and 17% XBI, equivalent to allocating roughly one-sixth of an equity portfolio to biotech.
That unlevered mix holds up on its own terms. Rebalanced daily from February 2006 through September 2026, 83% S&P 500 and 17% biotech compounded at 11.8% a year, against 11.2% for the S&P 500 alone, with a slightly smaller worst drawdown (51% versus 55%).[xiii]
Kelly deserves a haircut, and two caveats matter most. The first is estimation error. Twenty years of daily data sounds like a lot, but the standard error on an index’s average annual return is four to seven percentage points, as large as the gaps Kelly is exploiting. Split the sample in half and the unlevered biotech weight swings from roughly three quarters of the portfolio to slightly below zero.[xiv] The second is that Kelly takes the past distribution at face value, and about three quarters of biotech’s advantage in arithmetic mean return comes from the σ²/2 volatility add-back rather than from faster compounding, the same term that sent the lognormal model into fairytale land.[xv] Both argue for allocating a fraction of Kelly, which is exactly what the 17% figure already is: roughly 0.29 times full Kelly.
Rather than a precise prescription, I view this exercise as indicating the approximate size and direction of a sensible biotech allocation. Kelly does not prove that biotech deserves exactly 17% of an equity portfolio. It shows that the case for a meaningful allocation rests only on biotech continuing to earn something like the market’s return with a correlation well short of one, which has been true for the entire history we have. One dollar in six against half a percent is a more than 30-fold gap in how the market allocates to biotech. The supply of therapeutic biotech equity is small and, in the short run, roughly fixed, so if allocators moved even part of the way toward where the arithmetic points, those flows would have to be absorbed by price. Because the auction is reflexive, higher valuations mean cheaper capital and more experiments underwritten. With disciplined managers able to steer this capital toward scientifically worthwhile risks, this reflexive loop would result in more medicines, faster, without necessarily coming at the cost of reduced returns.
Chigurh’s Coin
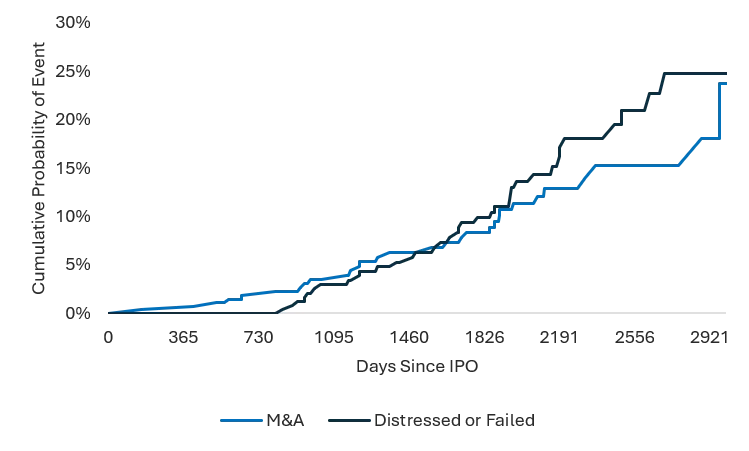
One way of looking at how well the continuous double auction sorts winners from losers is to look at the cumulative probability of M&A (as a proxy for success) and of distress or failure (measured by delisting, dissolution, acquisitions or mergers near cash value, or reverse takeovers) (Figure 5). Companies face a similar cumulative risk of M&A and of failure, and both progress at roughly the same rate.
Figure 5: Cumulative probability of M&A vs. distress or failure, by days since IPO
Source: Yahoo Finance, FactSet, Ascendant BioCapital Analysis; share price data as of August 31, 2026
It is intuitive that failure rates are proportionate to company age: some products just don’t work out and the market cuts them off. But why should the risk of M&A rise with age too? If the data demonstrate a blockbuster drug is in the pipeline, wouldn’t management, boards and investors want the company to hold onto that asset to maximize its NPV? One reason, which I’ve discussed in my previous letter, is that pharma is looking for exactly these types of assets. I would argue the more important factor is that companies remain on a financing treadmill, where they have to raise incremental equity almost into perpetuity. The valley of death in biotech is deep and wide. The companies that cross it independently are often happy accidents, distinguished by characteristics that place them outside pharma's usual acquisition criteria.
Regeneron is my favorite example. It went public in 1991 to regenerate neurons with recombinant neurotrophic factors, then cutting-edge technology. Its first program, CNTF, failed in ALS in 1994, ending the year 86% below its IPO price. Its second, BDNF, failed a Phase 3 in ALS in January 1997, and the stock fell 43% in a day. These were reasonable hypotheses to test in a horrible disease, and I admire the ambition. Regeneron also partnered nearly everything, giving away upside on each program but sparing its own shareholders some dilution. Pharma prefers clean, single-asset targets, and to pharma Regeneron looked encumbered. It pivoted away from neuronal regeneration, and the programs that ultimately succeeded were already spoken for by strategic partners. As a result, nobody bought it, and it got the rare opportunity to grow old.
It is also good that failure takes time. Figure 5 shows that eight years after listing, about one company in four has been acquired, about one in four is gone, and about half are still waiting to be sorted into the winners or losers. We are less clever about human biology than we like to think. Acetaminophen has been in clinical use since the 1890s, and pharmacologists still argue about how it works (one review called it “a familiar drug with an unexplained mechanism of action”). If we cannot fully explain a molecule that simple and that familiar, humility about any mechanistic story is paramount, and the confidence intervals around any prior should be assumed to be wide. That is not an argument for throwing darts. A good analyst can still underwrite a program against its priors, using the pathophysiology, the pharmacology and the precedent data, and update as the evidence comes in. Applied to a distribution as skewed as the one described above, even a modest edge in separating better hypotheses from worse ones matters a great deal, and it is a source of alpha that has little to do with the rest of a portfolio. Patience is the price of finding out whether the edge is real.
Impatience has a cost of its own. Without the discipline of waiting for the data, science becomes a race to the bottom, won by whoever is most confident that they are smarter than everyone else, the people hawking supplements and gray-market peptides on the strength of a narrative and a testimonial. Those claims never have to face an endpoint, so they never fail, and so they never teach us anything and likely cause harm from exposure to agents with toxicity potential (all substances are toxic; it is the dose that makes them so) with no known benefit. History already lived this chapter out with the rise and fall of American quackery and “Patent Medicines” from the late 19th century into the early 20th century.
In Cormac McCarthy’s No Country for Old Men, Anton Chigurh asks Carson Wells, just before killing him, “If the rule you followed brought you to this, of what use was the rule?” In the novel it’s a nihilistic taunt from a man who settles fates with a coin toss. Biotech readouts can feel like coin tosses, though weighted ones, and the rules are what keep them honest. A pre-specified endpoint, a p-value threshold and an independent readout don’t make the outcome kinder. They make it useful: a fast, unambiguous no for ideas that don’t work, so capital and talent can move on. If the readout is Chigurh’s coin, the rules are Sheriff Ed Tom Bell, the unglamorous lawman who insists the job be done properly whatever the outcome. A company put out to pasture is the system doing its job.
Compare that with the alternative of allocating capital through the retained earnings of pharmaceutical companies to R&D projects within large pharma. Without a price mechanism to reveal opportunity costs, capital allocation becomes an exercise in administrative fiat.[xvi] Money goes into a black box that is largely governed by human social behavior, with no clear profit or loss function applied to that behavior, and a few drugs come out the other end. That is clearly suboptimal when a continuous double auction exists that can provide price signals and determine whether a project should get the chance to succeed or fail in the first place.
Carrying the Fire in the Dark
The novel ends with Bell recalling a dream of his father riding ahead of him on horseback through a snowy, dark mountain pass, carrying fire in a horn. Bell has spent the book outmatched by chance he cannot explain, and the dream is his answer to random violence of Chigurh's coin: his father has gone on ahead to make a fire, and it will be there when he arrives.
Biotech is a business of experiments whose answers cannot be known until they are run. The market that funds those experiments prices each answer quickly and, on the whole, honestly: it cuts off weak hypotheses, it eventually punishes deception, and it gives ambitious failures like Regeneron’s room to become successes. The small companies running those experiments will supply most of the drugs that replace pharma’s expiring franchises, and an analyst with an edge in sorting them can earn a return that has little to do with the rest of a portfolio. Yet the data in the aggregate shows that biotech remains a rounding error in most portfolios. An asset class that is this under-owned and this responsible for the medicines of the future is, in every sense that matters, systemically important.
It is easy to be dismissive of biotech in the abstract. It gets harder on the day you or someone you love is diagnosed with a serious condition that might be treatable with medicine, the day you become grateful for every available therapeutic and for every small company that was allowed to fail its way toward one. Those therapies exist because someone funded a long list of experiments, most of which failed, and was patient enough to wait for the answers. They rode ahead in the dark, and the fire was already lit when we got there.
My last letter elicited some terrific feedback. Thank you for your engagement, questions, criticism and requests to discuss. Please keep it coming. I want to hear what you care about, have my theses challenged, and know when something isn’t clear or deserves further explanation.